Factsheets for: Acetaminophen
CHEMICAL IDENTITY
| Norman SusDat ID | NS00000231 |
|---|---|
| Name | Acetaminophen |
| CAS Registry Number | 103-90-2 |
| SMILES | CC(=O)NC1=CC=C(O)C=C1 |
| InChIKey | RZVAJINKPMORJF-UHFFFAOYSA-N |
| Molecular structure | 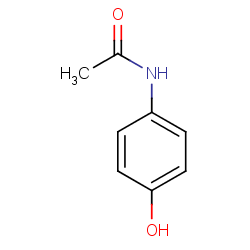 |
| Molecular formula | |
| Monoisotopic mass [g/mol] | 151.063329 |
| DSSTox Substance ID | DTXSID2020006 |
| PubChem CID | 1983 |
MAJOR USES
| General information | ||||||||||||||||||||||||
|---|---|---|---|---|---|---|---|---|---|---|---|---|---|---|---|---|---|---|---|---|---|---|---|---|
| Relevant media | ||||||||||||||||||||||||
| Use categories - NORMAN | ||||||||||||||||||||||||
| Product and Use Categories - DashBoard |
| |||||||||||||||||||||||
| Chemical Functional Use - DashBoard |
|
PROPERTIES
| LogKow experimental - DashBoard | |
|---|---|
| LogKow predicted - DashBoard | |
| Solubility experimental (mol/L) - DashBoard | |
| Solubility predicted (mol/L) - DashBoard | |
| Koc_min_experimental (L/kg) - DashBoard | |
| Koc_max_experimental (L/kg) - DashBoard | |
| Koc_min_predicted (L/kg) - DashBoard | 47.6 |
| Koc_max_predicted (L/kg) - DashBoard | 47.6 |
| Biodeg. Half-Life experimental (days) - DashBoard | |
| Biodeg. Half-Life predicted (days) - DashBoard | 3.55 |
| BCF experimental - DashBoard | |
| BCF predicted - DashBoard | 6.65 |
ENVIRONMENTAL OCCURENCE (all data)
Occurrence data (NORMAN – all data)
| Surface water (relevant matrix) |
No. of Countries | No. of Countries with Analysis > LOQ | No. of Stations | No. of Stations with Analysis > LOQ | No. of Analysis | Frequency of Quantification |
|---|---|---|---|---|---|---|
| Value | 11 | 8 | 372 | 239 | 1445 | 49.00 % |
| Score1 | n.a. | 0.5 | n.a. | 0.5 | n.a. | 0.49 |
Occurrence data (NORMAN – recent data2)
| Surface water (relevant matrix) |
No. of Countries | No. of Countries with Analysis > LOQ | No. of Stations | No. of Stations with Analysis > LOQ | No. of Analysis | Frequency of Quantification |
|---|---|---|---|---|---|---|
| Value | 5 | 3 | 60 | 10 | 61 | 18.03 % |
| Score1 | n.a. | 0.2 | n.a. | 0.2 | n.a. | 0.18 |
LOQmin, Median, Max and MEC95 (NORMAN – all data1)
| Matrix | LOQmin [µg/L] |
Median concentration [µg/L] | Max concentration [µg/L] | MEC95 [µg/L] (all data) | MEC95 [µg/L] (recent data) |
|---|
1 According to the NORMAN Prioritisation Methodology (Dulio & von der Ohe 2013)
2 Occurrence data from 2021 – 2026
MEC95 is the 95th percentile of the measured Maximum Environmental Concentrations at one site
ENVIRONMENTAL OCCURENCE (detailed information)
Per Country
| Country | No. of stations | No. of analyses | 2001 | 2006 | 2007 | 2008 | 2009 | 2010 | 2011 | 2012 | 2013 | 2014 | 2015 | 2016 | 2017 | 2018 | 2019 | 2020 | 2021 |
|---|---|---|---|---|---|---|---|---|---|---|---|---|---|---|---|---|---|---|---|
| Antarctica | 4 | 18 | 8 | 7 | 3 | ||||||||||||||
| Austria | 12 | 43 | 7 | 34 | 2 | ||||||||||||||
| Belgium | 3 | 5 | 5 | ||||||||||||||||
| Bulgaria | 12 | 60 | 60 | ||||||||||||||||
| Croatia | 12 | 38 | 14 | 24 | |||||||||||||||
| Czech Republic | 15 | 38 | 10 | 8 | 20 | ||||||||||||||
| Denmark | 7 | 9 | 2 | 1 | 6 | ||||||||||||||
| France | 2378 | 34548 | 81 | 2883 | 87 | 354 | 366 | 613 | 5389 | 6069 | 6991 | 5956 | 5756 | 3 | |||||
| Georgia | 39 | 130 | 72 | 30 | 28 | ||||||||||||||
| Germany | 303 | 2556 | 873 | 1176 | 28 | 3 | 116 | 169 | 151 | 40 | |||||||||
| Greece | 4 | 6 | 1 | 5 | |||||||||||||||
| Hungary | 22 | 90 | 7 | 81 | 2 | ||||||||||||||
| Ireland | 6 | 12 | 10 | 2 | |||||||||||||||
| Italy | 4 | 4 | 1 | 3 | |||||||||||||||
| Moldova, Republic Of | 7 | 21 | 21 | ||||||||||||||||
| Montenegro | 13 | 39 | 39 | ||||||||||||||||
| Netherlands | 252 | 3120 | 32 | 142 | 302 | 373 | 256 | 591 | 104 | 224 | 366 | 421 | 300 | 9 | |||||
| Norway | 2 | 4 | 2 | 1 | 1 | ||||||||||||||
| Poland | 5 | 5 | 1 | 1 | 3 | ||||||||||||||
| Portugal | 38 | 629 | 144 | 207 | 207 | 69 | 2 | ||||||||||||
| Romania | 16 | 45 | 3 | 20 | 21 | 1 | |||||||||||||
| Russian Federation | 6 | 12 | 2 | 10 | |||||||||||||||
| Serbia | 15 | 71 | 7 | 64 | |||||||||||||||
| Slovakia | 18 | 77 | 7 | 2 | 68 | ||||||||||||||
| Slovenia | 11 | 24 | 1 | 15 | 8 | ||||||||||||||
| Spain | 91 | 555 | 309 | 228 | 1 | 3 | 11 | 2 | 1 | ||||||||||
| Sweden | 54 | 150 | 16 | 76 | 2 | 4 | 6 | 8 | 14 | 2 | 22 | ||||||||
| Switzerland | 21 | 187 | 24 | 135 | 12 | 16 | |||||||||||||
| Ukraine | 97 | 350 | 120 | 50 | 33 | 146 | 1 | ||||||||||||
| United Kingdom | 25 | 49 | 12 | 28 | 1 | 7 | 1 |
Per Matrix
| Matrix | Total no. of analyses | No. of analyses above LoQ | Max | Median | Unit | Lowest PNEC | EQS |
|---|---|---|---|---|---|---|---|
| Surface water - Sea water | 95 | µg/l | 46 | ||||
| Surface water - River water | 33272 | 11954 | 130 | 0.0069 | µg/l | 46 | |
| Surface water - Lake water | 86 | 19 | 0.09 | 0.043 | µg/l | 46 | |
| Surface water - Transitional water | 35 | 15 | 0.36 | 0.17 | µg/l | 46 | |
| Surface water - Other | 97 | 27 | 0.54 | 0.1 | µg/l | 46 | |
| Ground water | 1023 | 198 | 0.481 | 0.007 | µg/l | 46 | |
| Waste water - Urban | 343 | 280 | 4405.12 | 0.1376 | µg/l | 46 | |
| Waste water - Industrial | 3 | 2 | 1.2888 | 0.0270314 | µg/l | 46 | |
| Waste water - Municipal | 295 | 220 | 1905.52 | 20.074 | µg/l | 46 | |
| Waste water - Other | 223 | 202 | 37399.6 | 25152.2 | µg/l | 46 | |
| Sediments - River water | 12 | µg/kg dry weight | 182 | ||||
| Sediments - Transitional water | 4 | 4 | 69 | 69 | µg/kg dry weight | 182 | |
| Sediments - Coastal water | 30 | µg/kg dry weight | 182 | ||||
| Sediments - Territorial (marine) water | 30 | µg/kg dry weight | 182 | ||||
| Sewage sludge - Municipal | 3 | 3 | 73 | 11 | µg/kg dry weight | ||
| Sewage sludge - Other | 19 | 1 | 330 | 330 | µg/kg dry weight | ||
| Biota - River water | 29 | 1 | 3 | 3 | µg/kg wet weight | 306 | |
| Biota - Lake water | 33 | µg/kg wet weight | 306 | ||||
| Biota - Transitional water | 1 | µg/kg wet weight | 306 | ||||
| Biota - Coastal water | 61 | µg/kg wet weight | 306 | ||||
| Biota - Territorial (marine) water | 75 | µg/kg wet weight | 306 | ||||
| Biota - Terrestrial | 33 | µg/kg wet weight | 306 |
(ECO)TOXICITY
| Lowest PNEC fresh water (μg/L) | 46 |
|---|---|
| Experimental / predicted | deterministic |
| Species | n.r. |
| AF | 10 |
| Endpoint | |
| Reference | PNEC-ID-0347746 |
| Lowest PNEC marine water (μg/L) | 13.4 |
| Lowest PNEC sediment (µg/kg dw) | 182 |
| Lowest PNEC biota (µg/kg ww) | 306 |
PBT/vPvB & PMT/vPvM (NORMAN)
Under construction
CMR & ED (NORMAN)
Under construction
POTENTIAL RISK OF EXCEEDANCE OF LOWEST PNEC
Summary: Risk of Exceedance of the Lowest PNEC
| Value | Score1 | |
|---|---|---|
| Frequency of Exceedance | 0.00 % | |
| Extent of Exceedance | 0.00 |
1 According to the NORMAN Prioritisation Methodology (Dulio & von der Ohe 2013)
CONCLUSIONS AND RECOMMENDATIONS
Under construction
BIBLIOGRAPHY, SOURCES AND SUPPORTIVE INFORMATION
Dulio V. and Von der Ohe P. (2013) NORMAN Prioritisation framework for emerging substances. NORMAN Association, Verneuil en Halatte, France, 70 pages.
NORMAN organises the development and maintenance of various web-based databases for the collection & evaluation of data / information on emerging substances in the environment
NORMAN Database System
Contact Us
Email: slobodnik@ei.sk
Email: norman@ei.sk
Url: https://www.norman-network.com/
Url: https://www.norman-network.net/
Url: https://www.normandata.eu/
2026 © All Rights Reserved. Privacy Policy